Case study · Committee for Children
Bringing social-emotional learning onto one platform
Our UX team shaped one role-based Second Step learning platform for teachers, principals and district leaders at Committee for Children.
- Role
- UX lead, Second Step Learning Platform
- Organization
- Committee for Children
- Platform
- Web learning platform (SecondStep.org)
In short
- 01Second Step's social-emotional learning programs had been built online one product at a time, so each one worked differently for the same teachers and school leaders.
- 02Our UX team set the design process, led information architecture across the product teams and concepted role-based dashboards.
- 03The work produced a proposed shared navigation for middle school and elementary, a role model for the platform, and dashboard concepts that shaped the next round of research.
- personas · district SEL director, principal, teacher, counselor
- journey mapping · school admin and teacher
- content audit / affinity mapping · unit and lesson pages, must / should / could / won't have
- information architecture / site maps
- IA and navigation competitive analysis
- user stories by role
- wireframes
- dashboard concepts
01Opportunity
Every program had its own site and its own logic
Committee for Children makes Second Step, a social-emotional learning (SEL) curriculum used in schools. It spanned early learning through middle school, add-on units for bullying prevention and child protection, Mind Yeti, out-of-school-time programs and SEL for adults.
Each online product had been built on its own. A technology review found that this led to inconsistent experiences for common tasks, and recommended one new platform driven by content, instructional design and user experience.
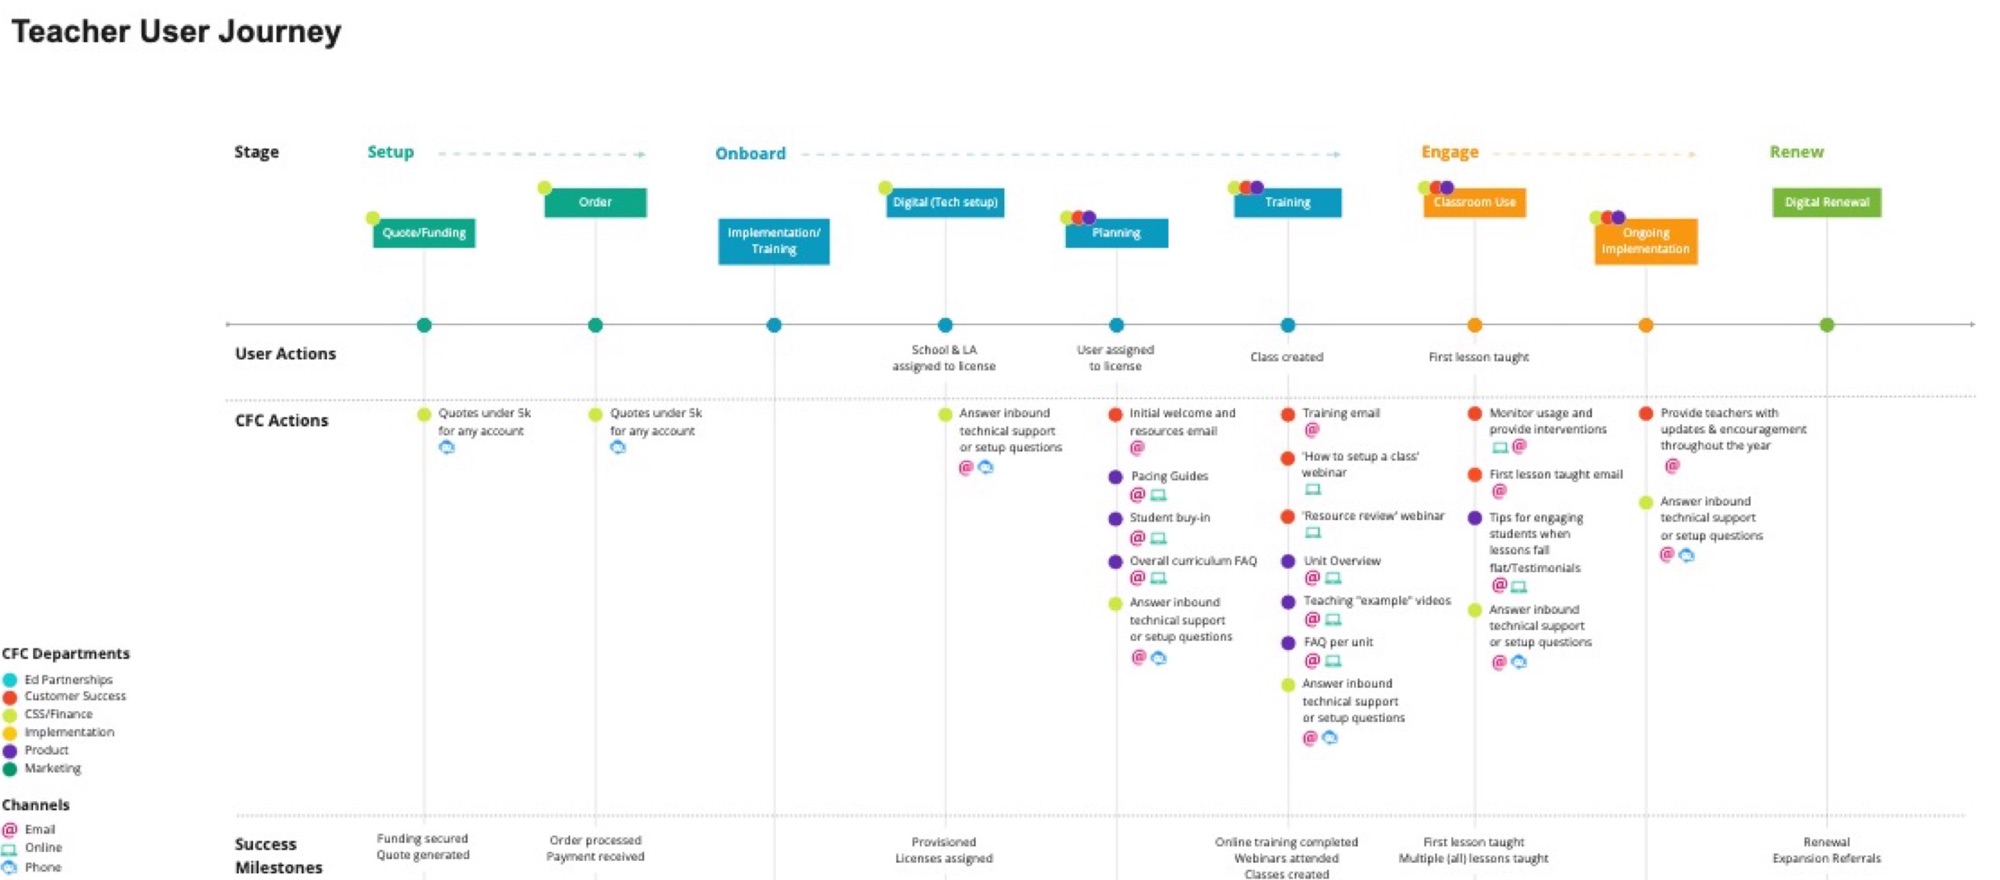
The people using it had little time. Our teacher persona had about 15 minutes a day to prepare. A teacher's journey ran from setup and onboarding through training, the first lesson taught and renewal, with different staff and channels at every step.
02Hypothesis
One platform, organized by role rather than by product
The bet was that a district director, a principal and a teacher should each land on what they need, whatever mix of programs their school bought.
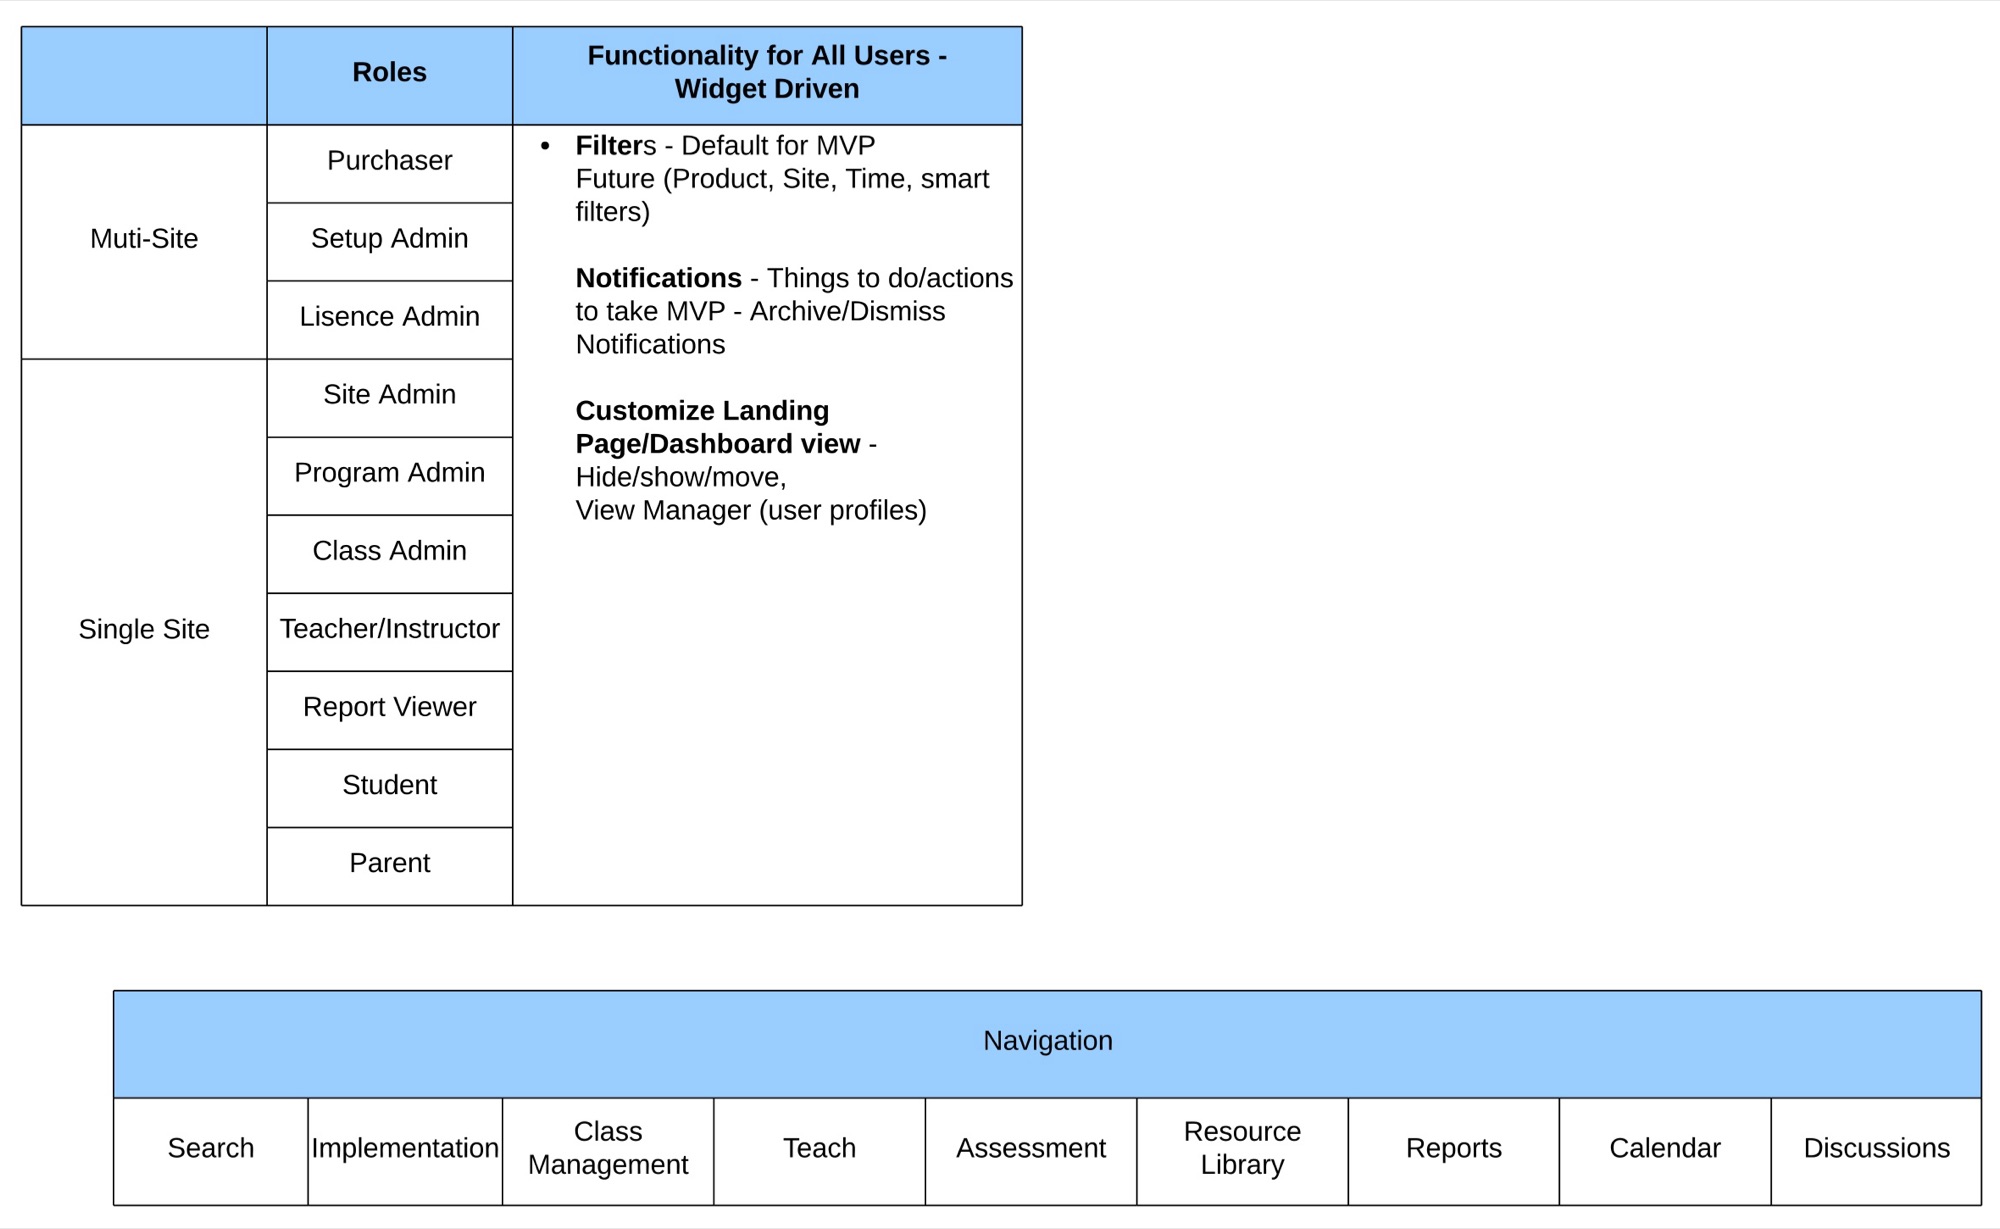
We defined the roles first: purchaser, setup and license admins at multi-site level, then site admin, program admin, class admin, teacher, report viewer, student and parent at a single site. Every role would share one navigation and a widget-driven dashboard with filters, notifications and a view they could customize.
We set out how the UX team would work: discovery and planning, define, design, build and deploy, measure. Personas, journey maps, card sorts and use cases came before screens.
03Experiments
We tested the IA against two very different programs
We led the information architecture for the platform's first release with five teams: the elementary 4th Edition and its add-on units, middle school, SecondStep.org, SecondStep.org UX and analytics. The goals were to simplify the middle school and Early Learning–Grade 5 structures, reach parity across products where we could, and add role-specific dashboard content.
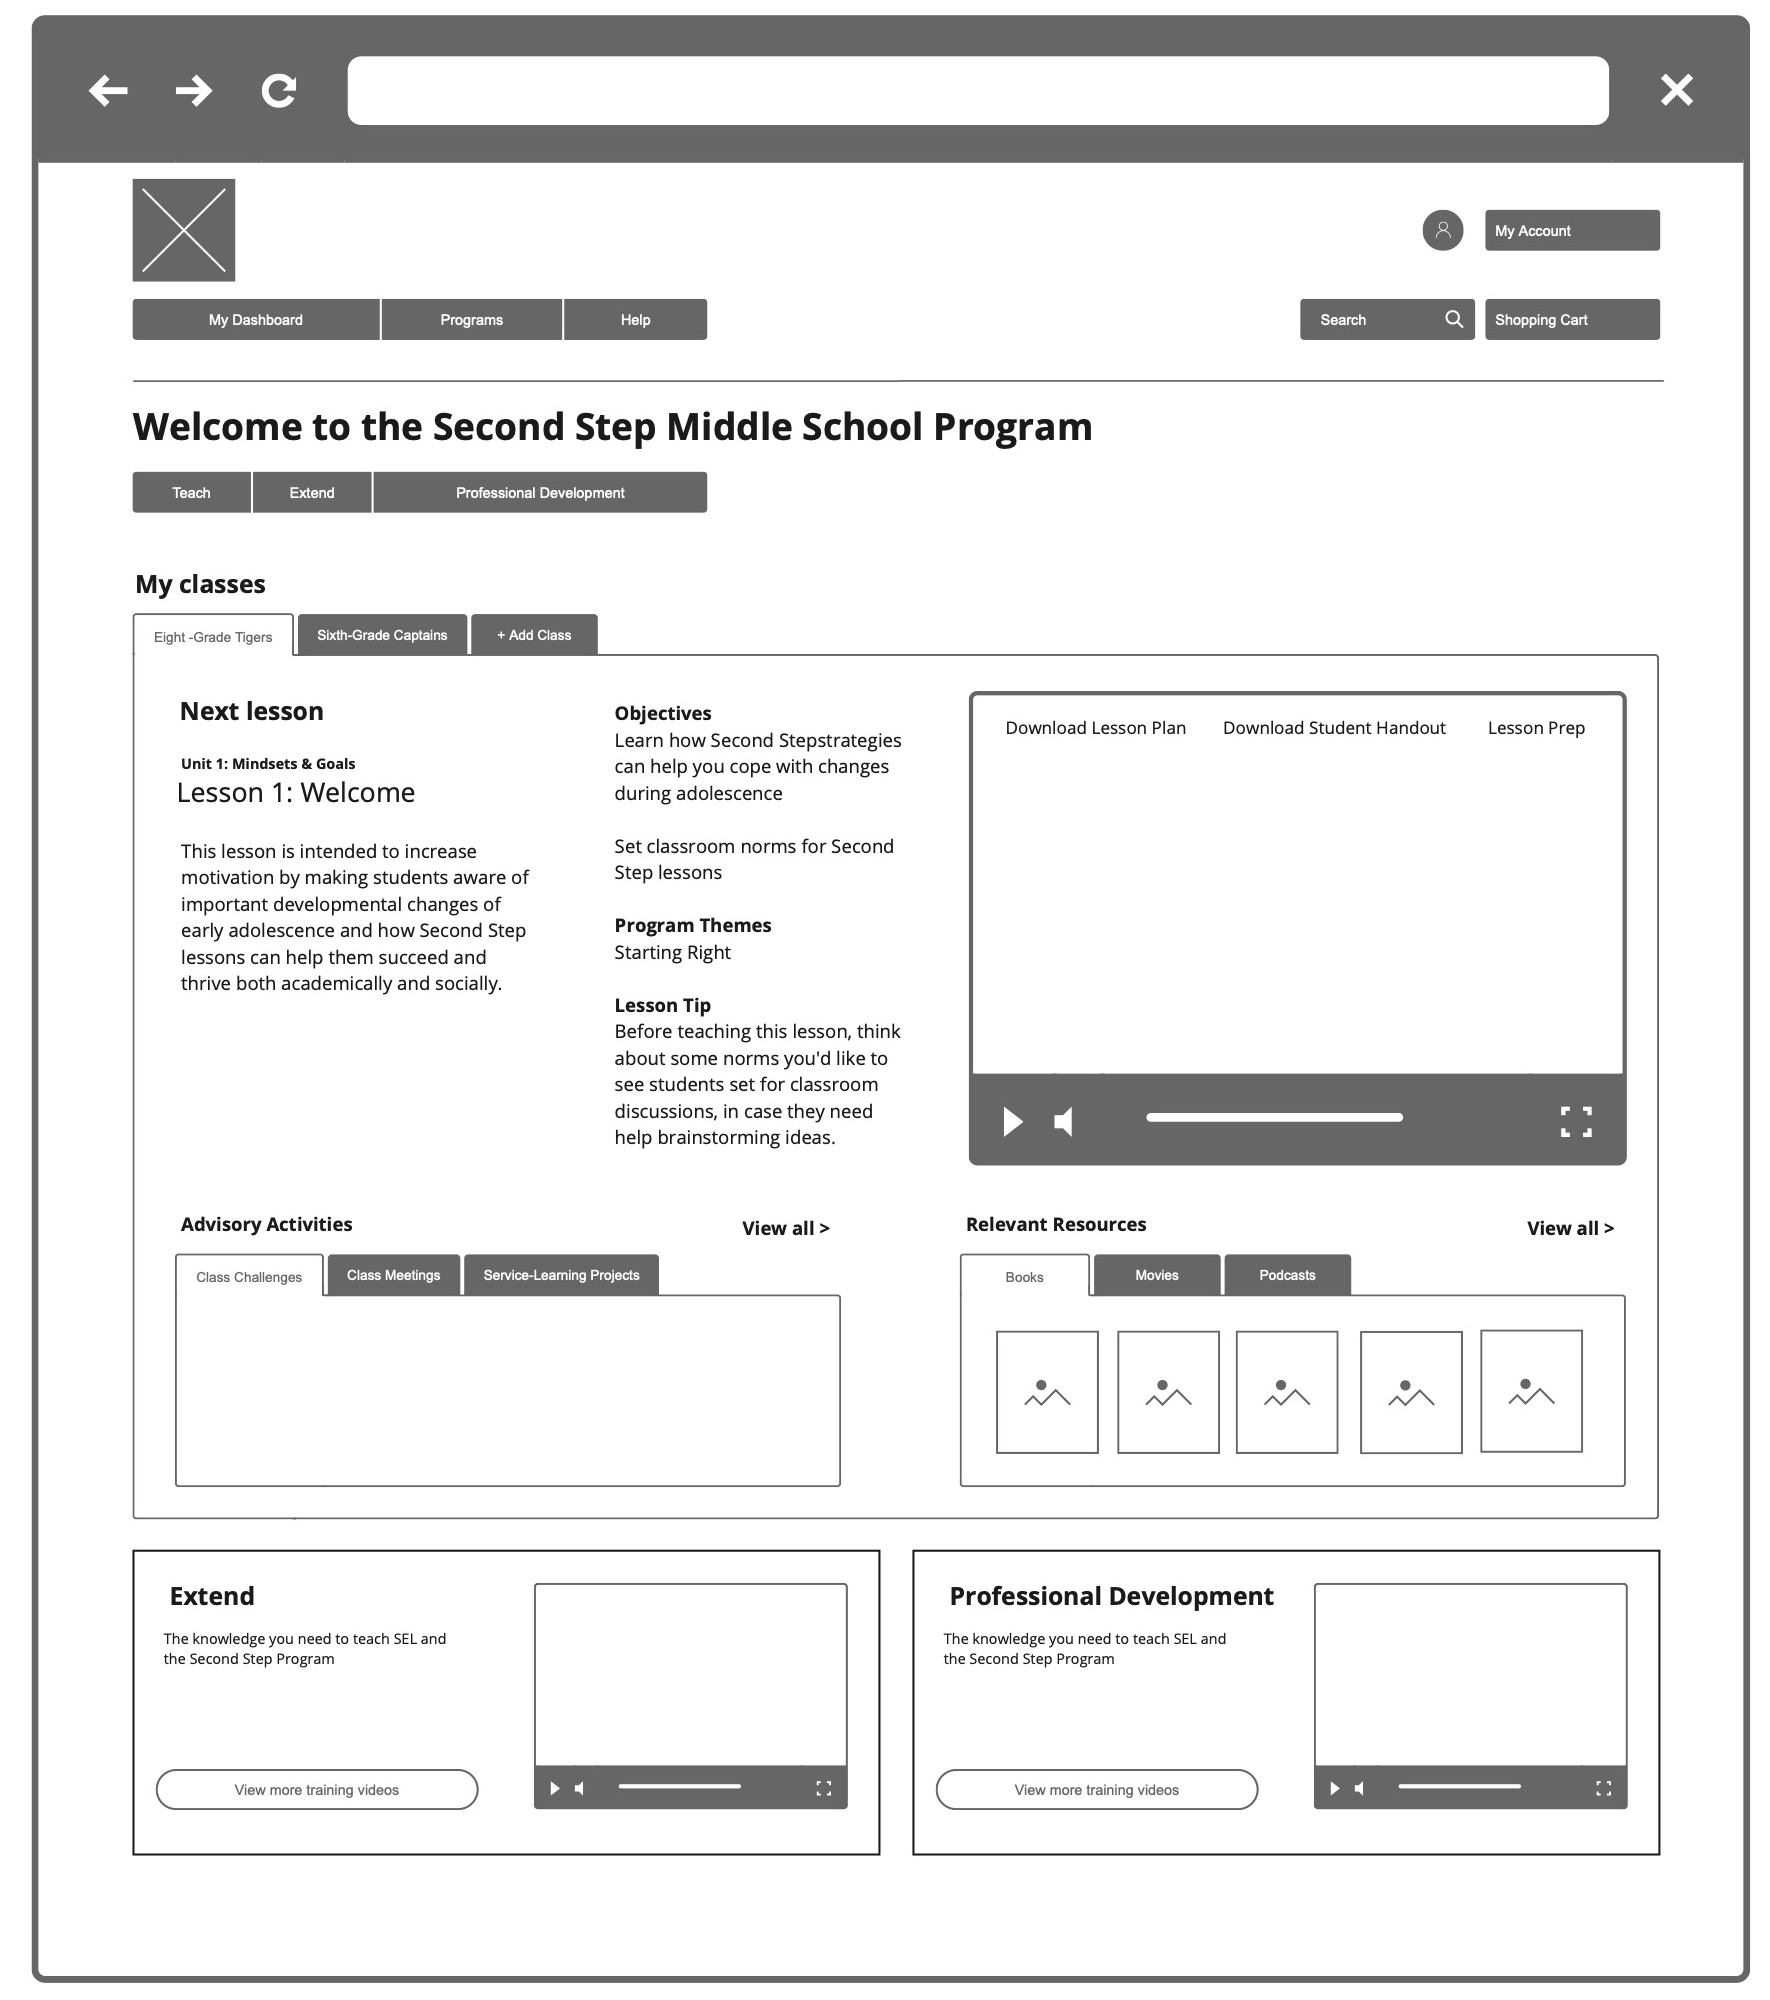
We audited the unit and lesson pages and affinity-mapped their content into must have, should have, could have and won't have. That fed wireframes of a teach page built around one question: what is my next lesson?
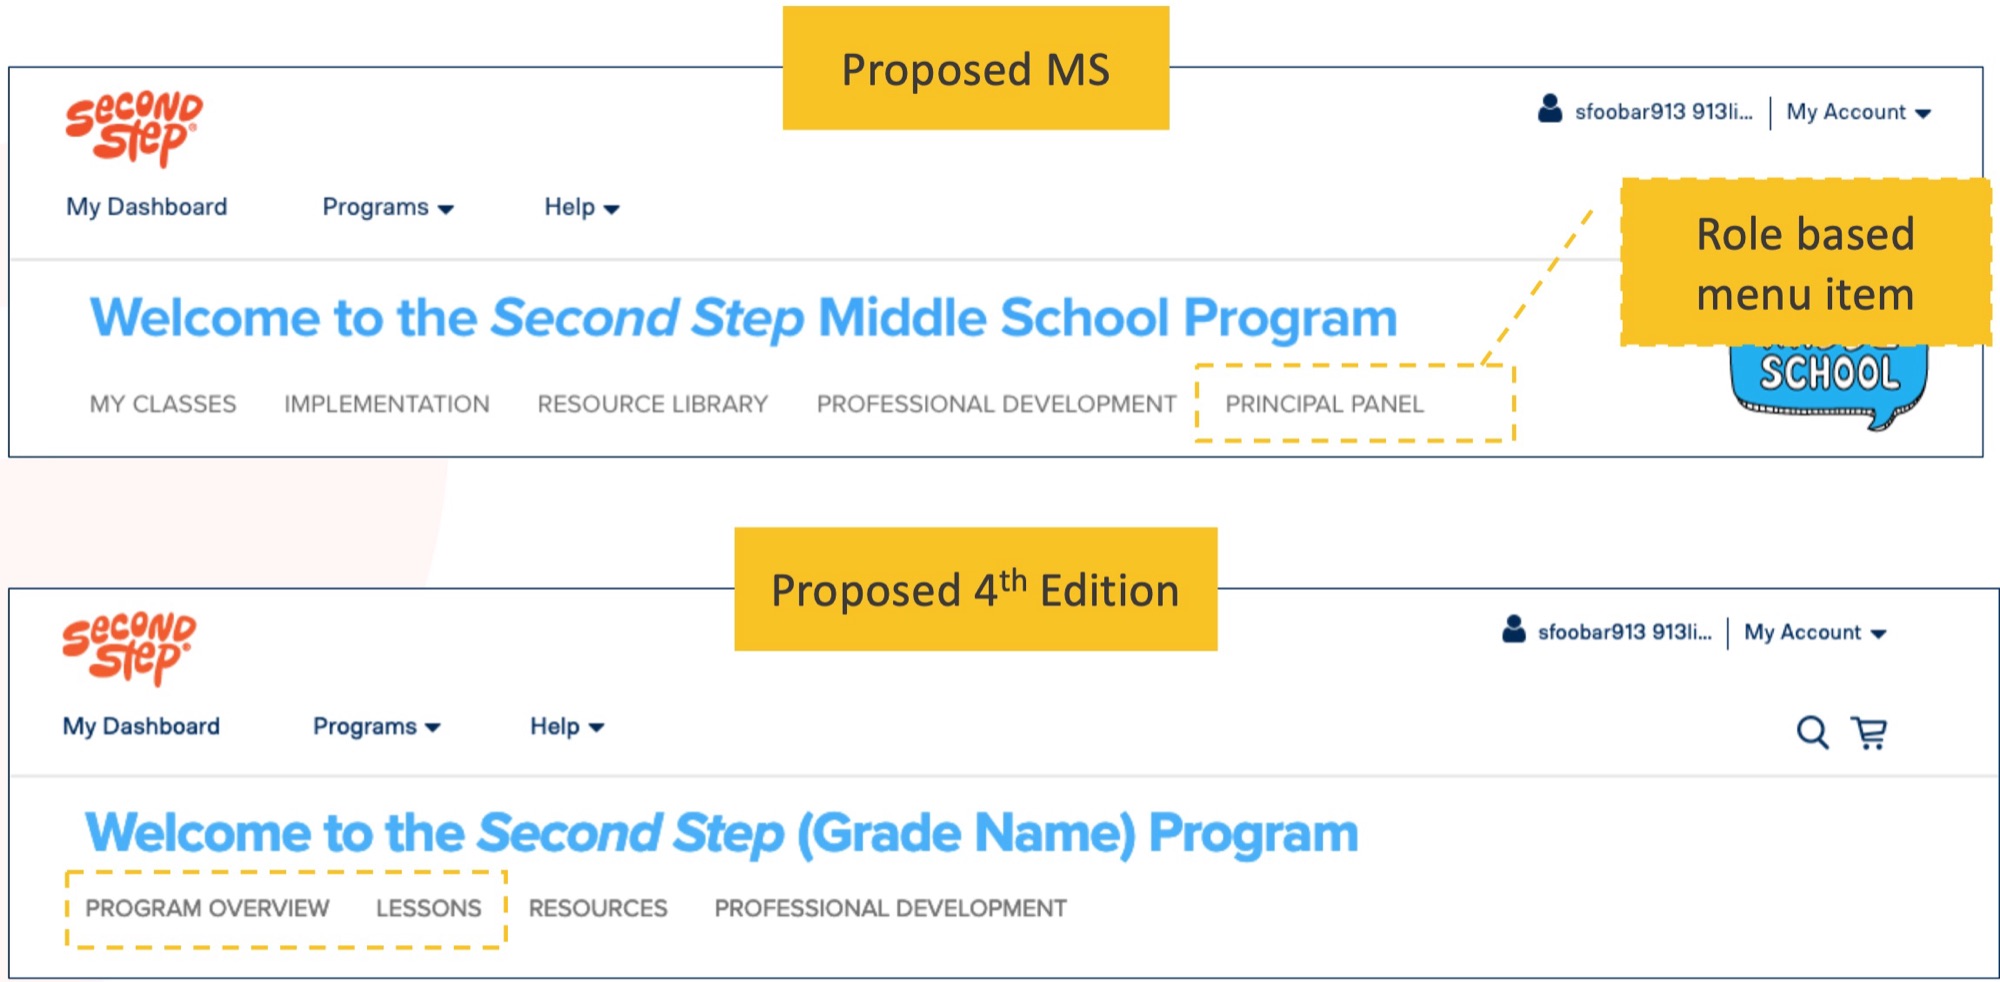
Then we laid the middle school and elementary navigation side by side. Parity had limits. The unit view in each product worked differently, and we chose to get as close as we could without breaking either experience, not consistency for its own sake.
04Learning
A teacher's dashboard and a district's dashboard are different products
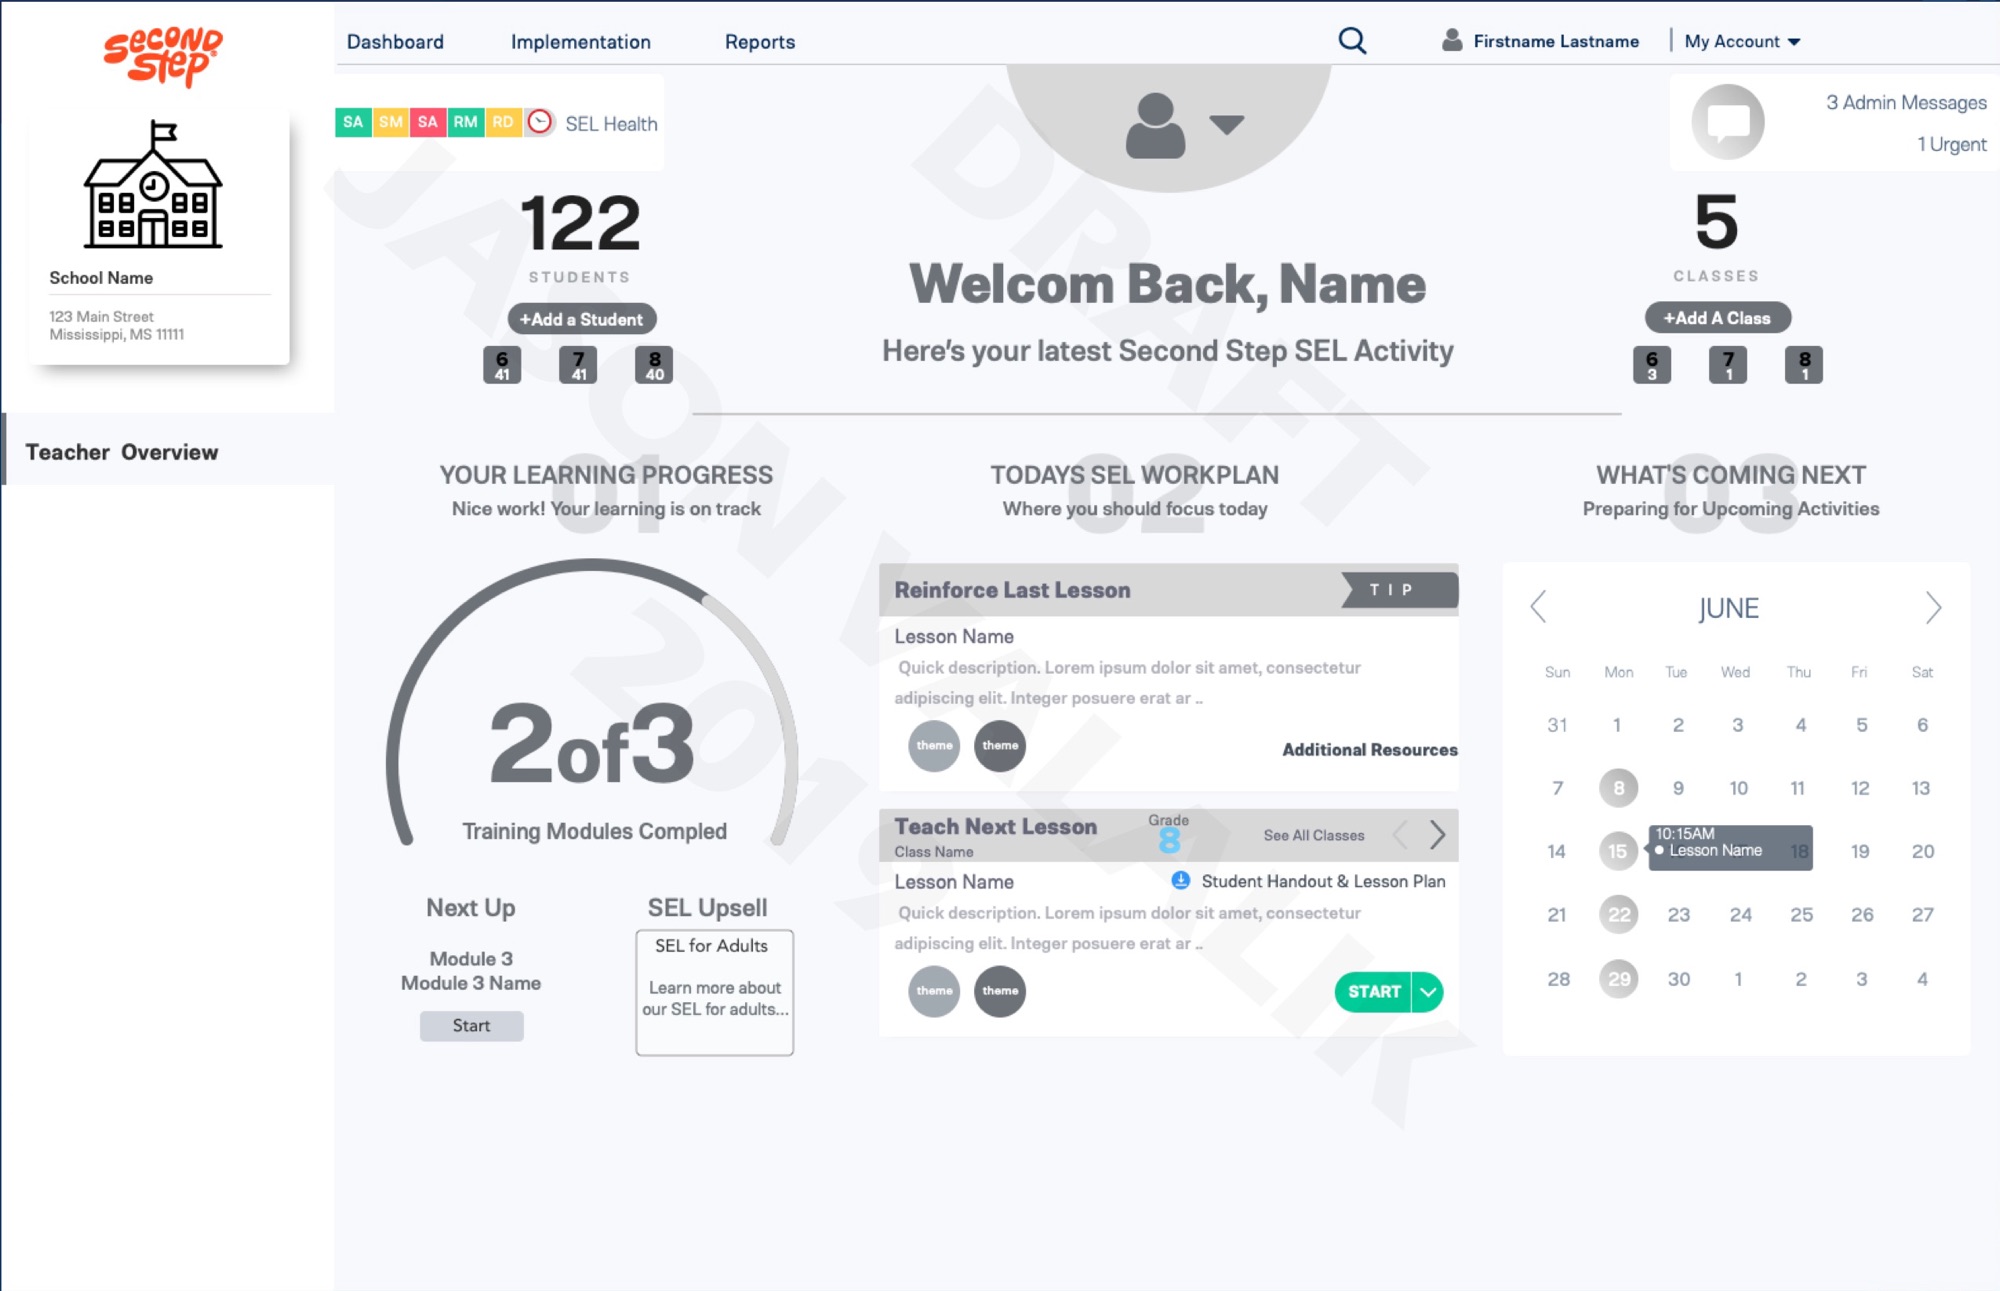
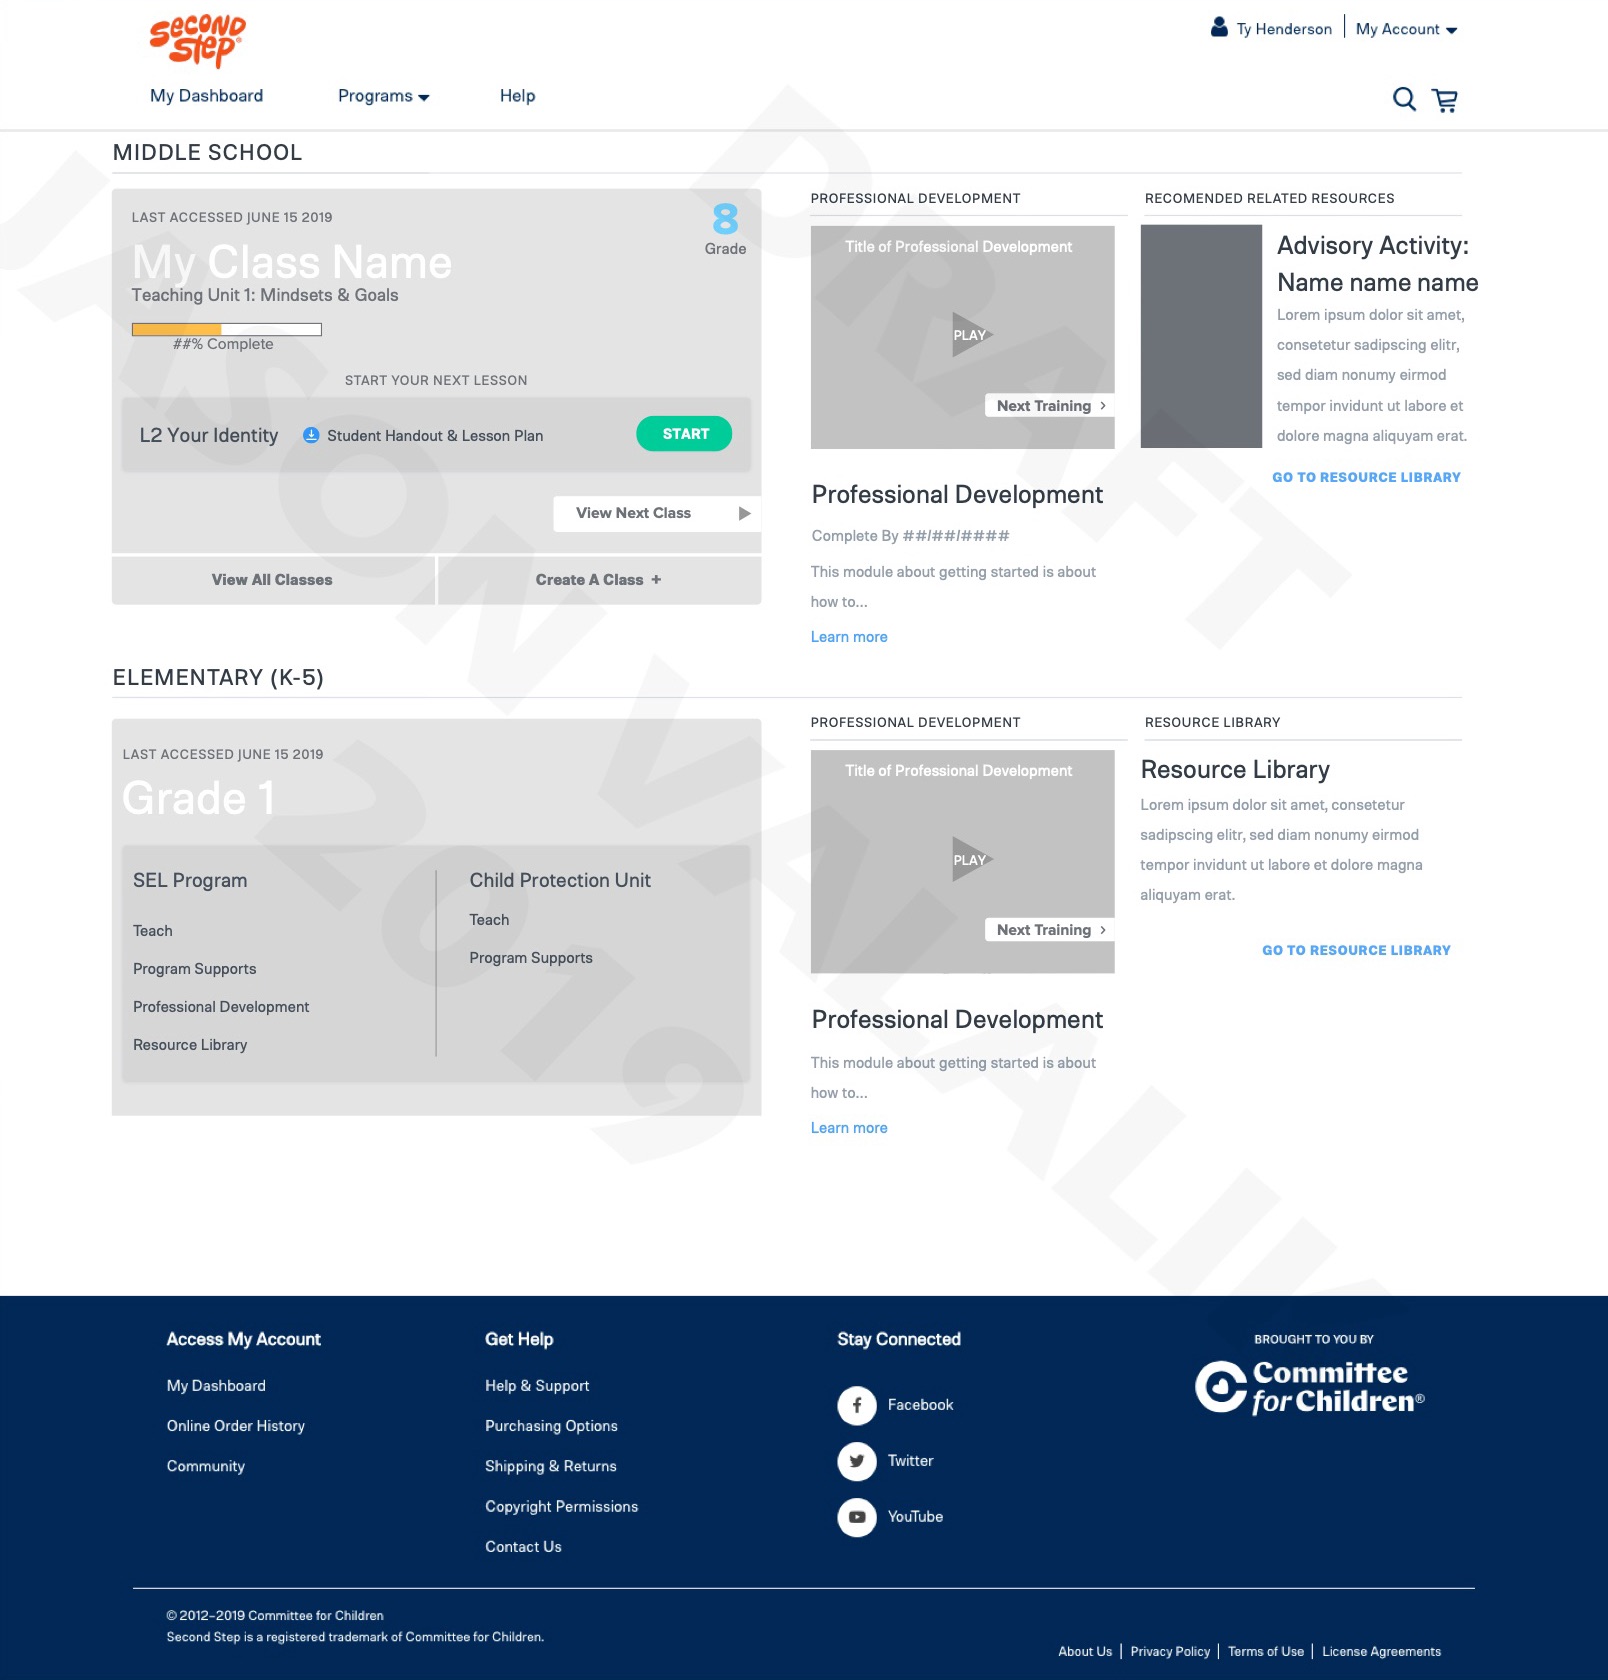
We took dashboard concepts to a vision workshop: a fall version 1.5 that added classes and products to the existing page, and a 2.0 concept for the year after. They were deliberately rough, meant to drive discussion and to act as research stimulus.
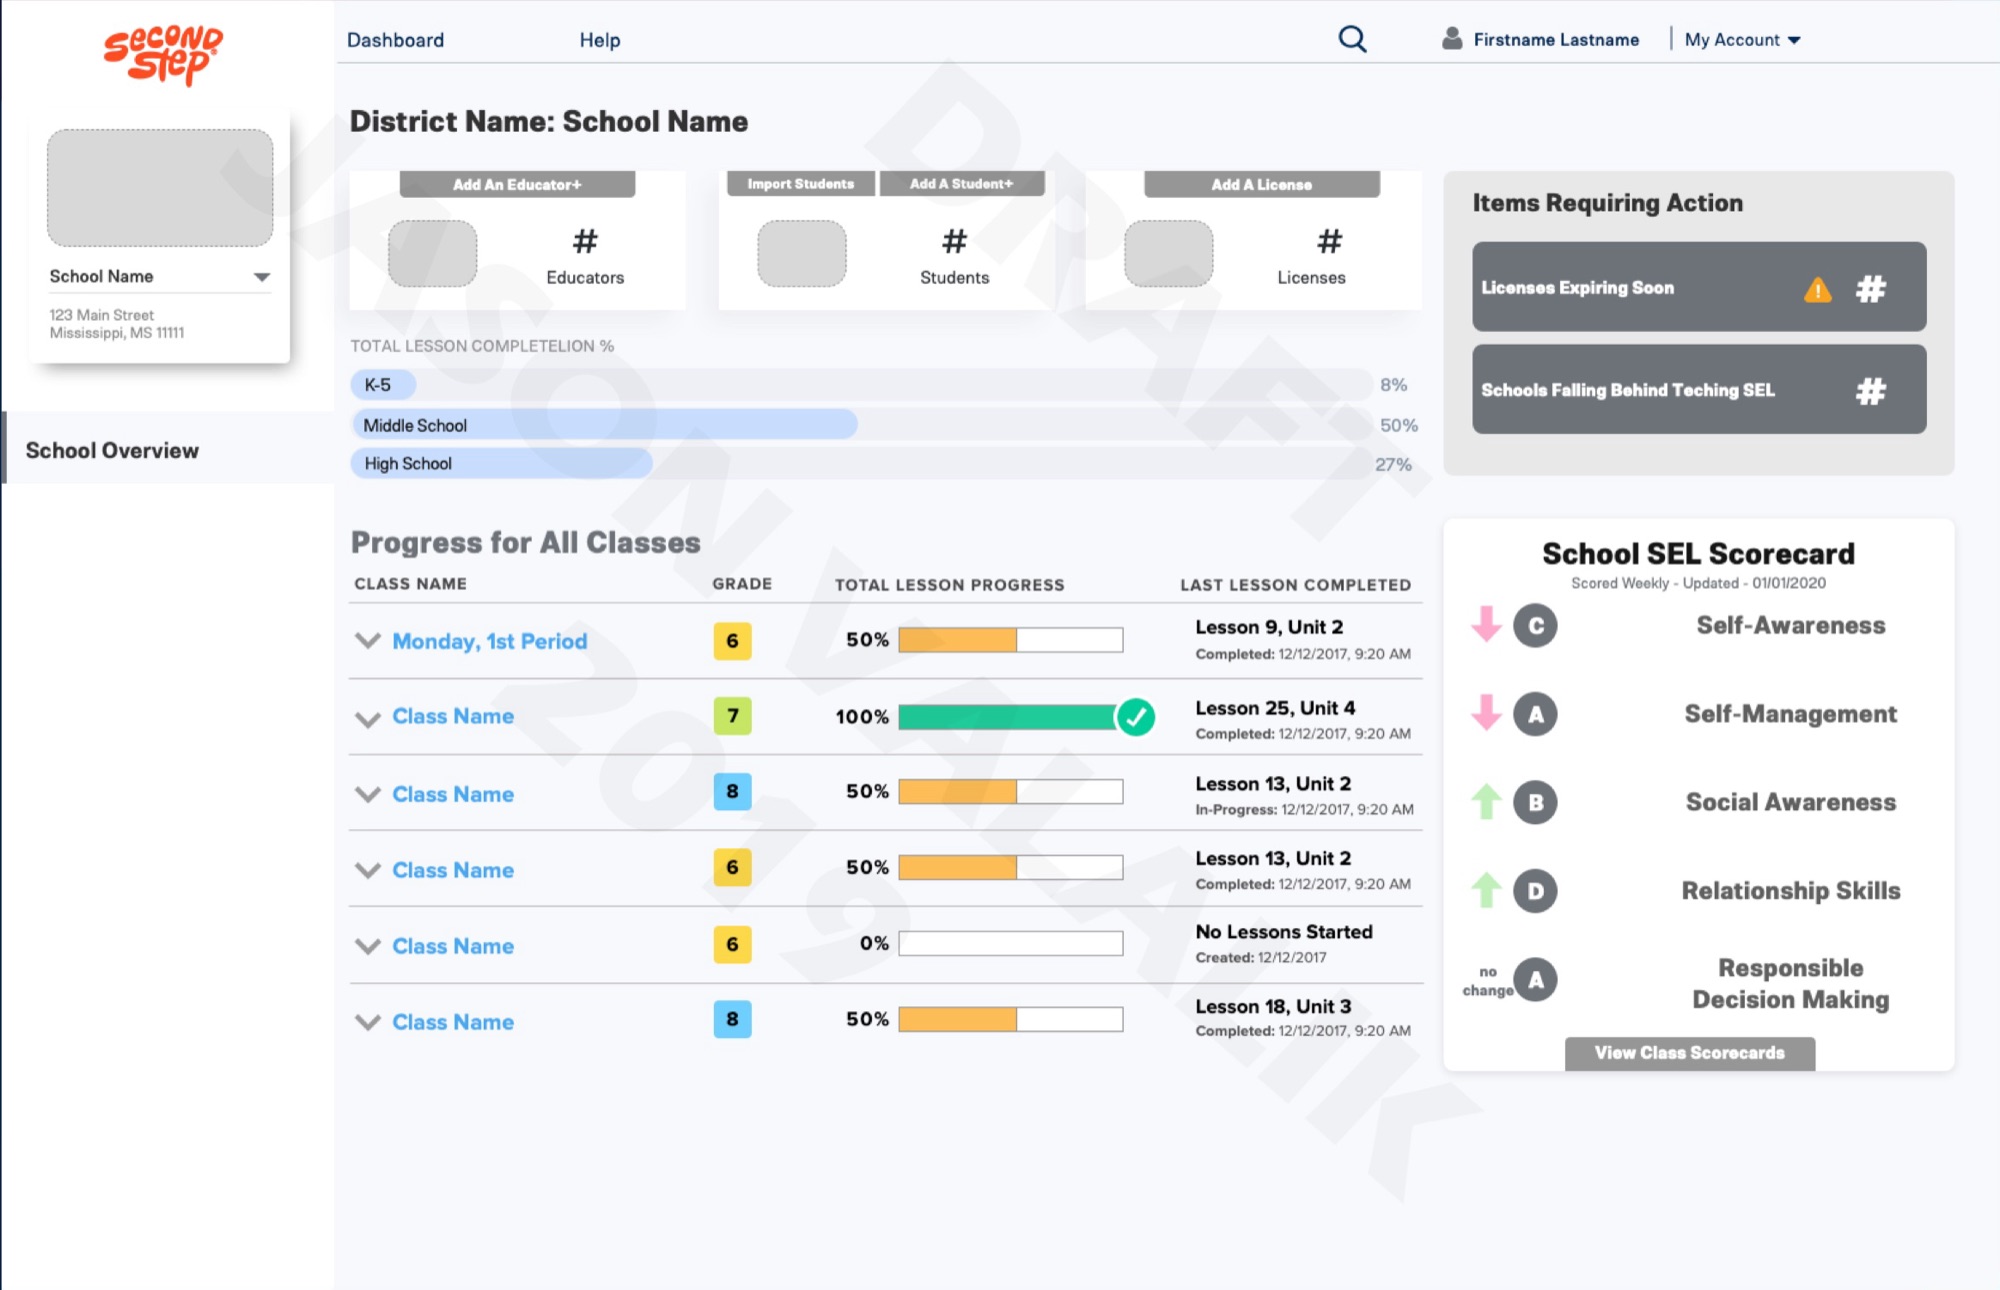
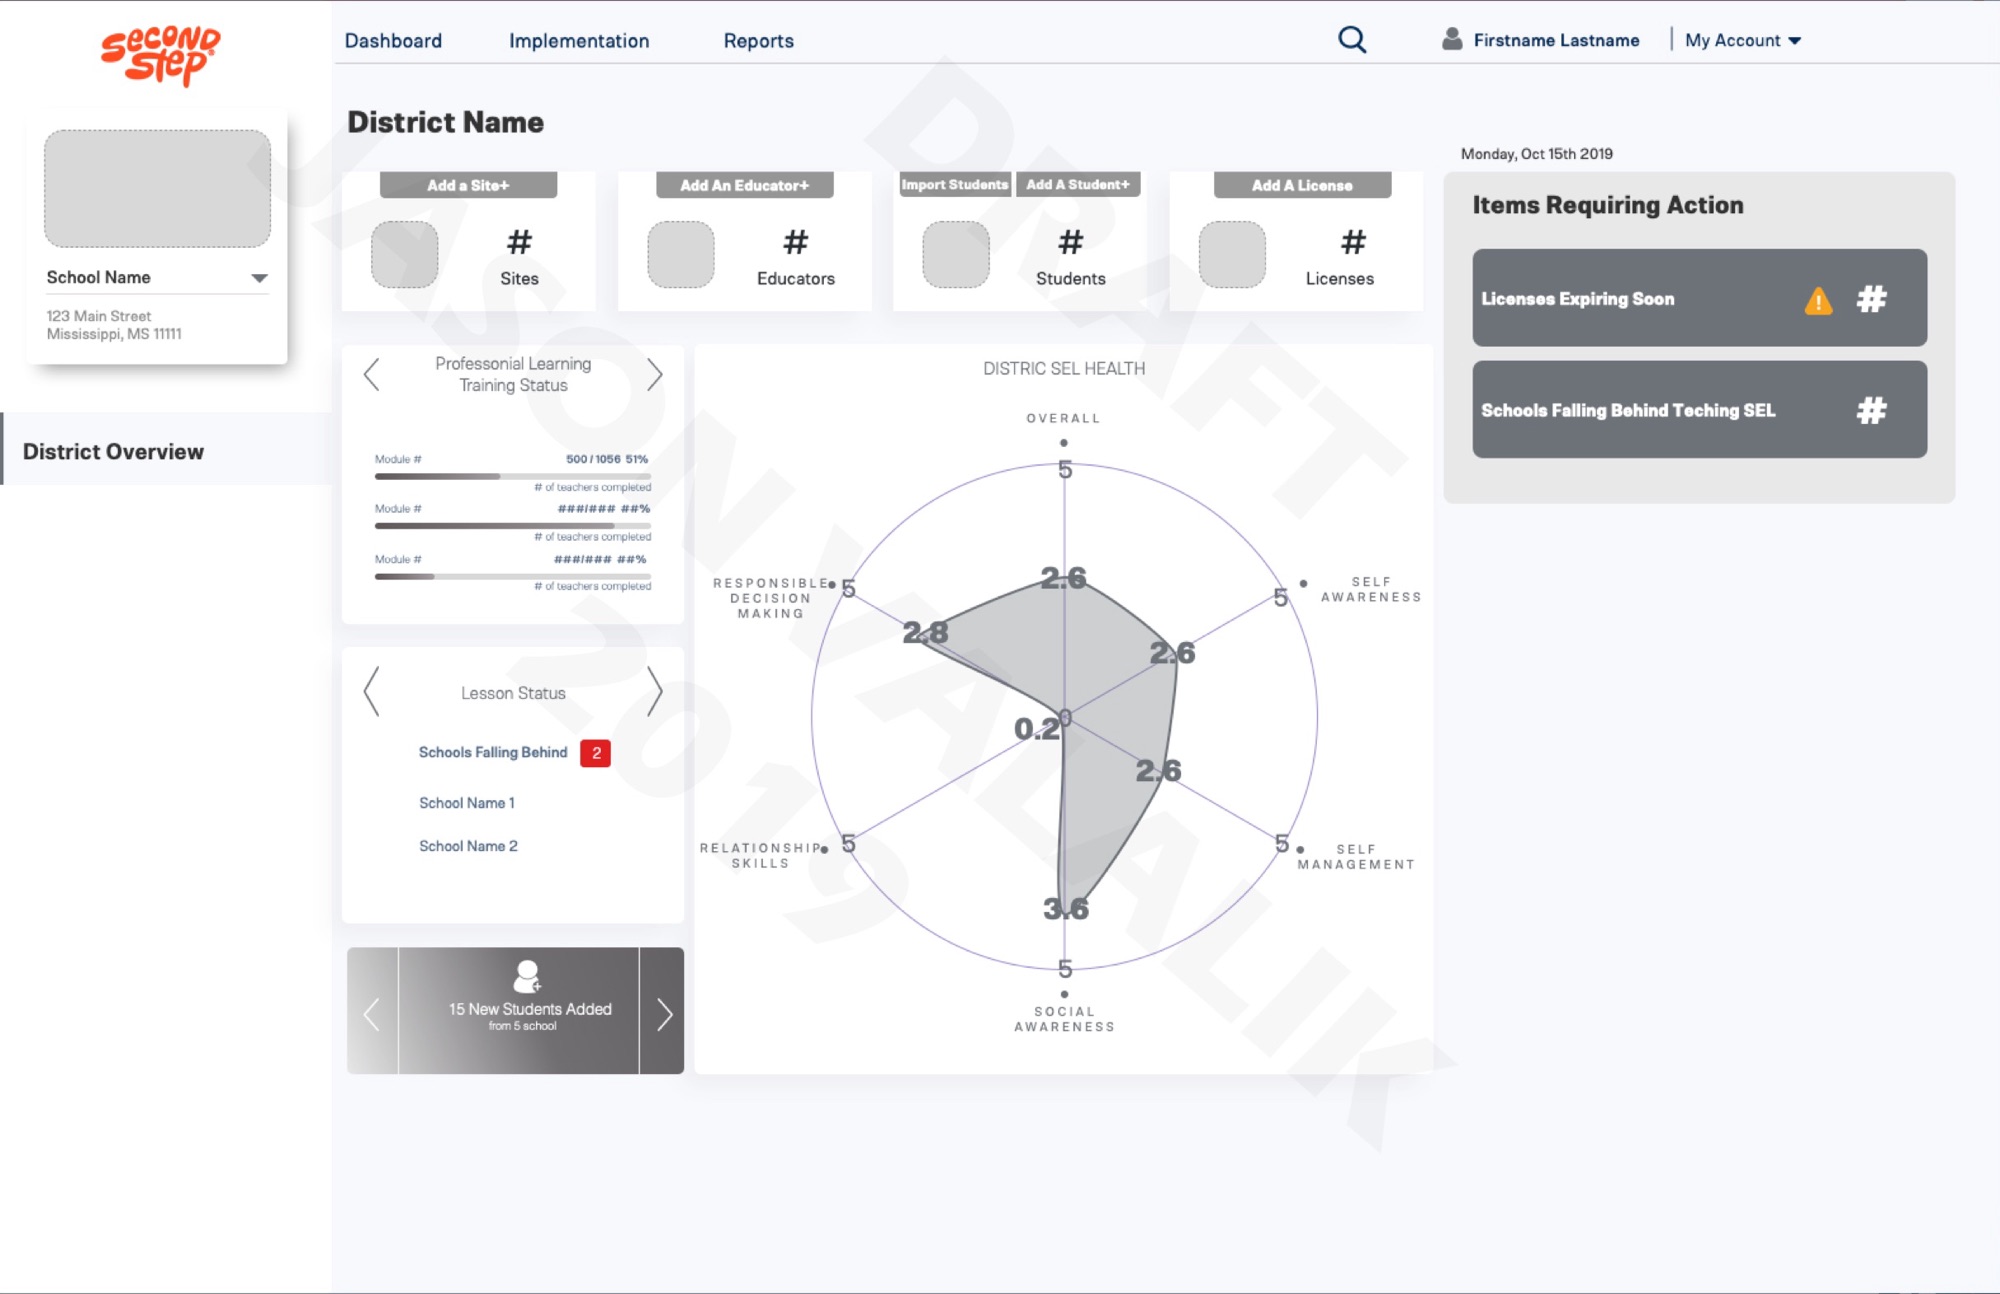
Writing user stories per role made the split clear. A teacher wants to launch the next lesson and see if students understood it. A principal wants usage and progress by grade and class. A district admin needs to know which sites aren't implementing the program, and how many licenses and students they have.
So the 2.0 concepts became three views on one structure: teacher, school and district, each with items requiring action and an SEL scorecard across the five competencies.
05Decision
We put the district view and research ahead of more screens
The workshop ended with a plan to iterate and validate: survey the district audience on features, write a research plan with the researchers, and define the story for each persona at dashboard level.
A later KPI offsite pointed the same way. The analytics recommendation was to prioritize a district dashboard, even one that only showed usage, because giving data back to districts would help them fix implementation and would encourage schools and teachers to share more. We worked with the researchers on planning a study of district, principal and teacher reporting needs.
The concepts were never meant to be the final design. Their job was to make the role question concrete enough to research.